AI isn't plateauing.
The return on compute is.
Capability climbs in a straight line. The inputs that buy it don't. We measure both, every week, from public data — and the shapes are telling you something the leaderboards can't: an order of magnitude of training compute now buys roughly half the capability it bought in 2023, while two-thirds of frontier progress now comes from algorithm — not scale.
The misleading signal: capability itself never stops
If you only watch the output axis — benchmarks, capability indices, model scores — there is no plateau. The reasoning-era frontier has been a straight line at 13.9 ECI/yr since o1 (Sep 2024), and advancing 15.8 ECI/yr over the trailing twelve months. Benchmarks saturate not because models stall but because the measurement barrel fills. This is why "is AI slowing?" debates keep ending in nothing.
The real signal: each OOM buys half what it did
Capability is an output. Inputs are FLOPs, parameters, data — and each one is running out of loyalty. Fit capability as a function of compute and time together (ECI = c₀ -114 + 8.8·(yr−2024) + 9.6·log₁₀FLOP):
The doom curve is real, and it sits on the compute axis. At fixed time, each 10× of compute adds 9.6 ECI (R² 0.73); the fitted iso-time lines below rise then flatten. Yet the frontier keeps moving — which means the moves are now being paid for by the time term (algorithmic, post-training, data efficiency), not by the size term.
The counter-signal: intelligence per parameter is still climbing
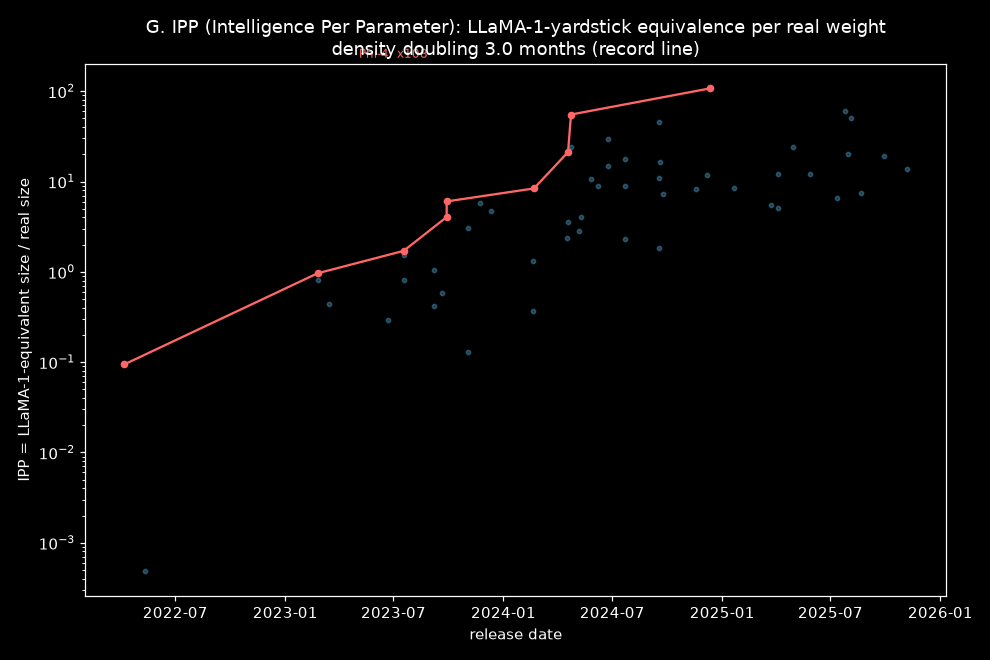
The reason it's not "over": the same-sized brain keeps getting smarter. At fixed compute, capability gains 8.8 ECI/yr; at fixed parameter count, ≈11 ECI/yr. Measured as LLaMA-2023-equivalents per real weight (IPP), the density record line doubles every 3.0 months. By that ruler, a 15B model in 2024 carried ≈100× a 2023 Llama of the same size. Computers got 10× less efficient at converting FLOPs into capability; weights got ~7% more useful every year.
The consequence: a barrel, not a wall
Benchmarks don't plateau; they fill. 48% of the 60 benchmarks we track sit at ≥80% best-score; 27% are ≥90%. The field answers by re-spawning harder tests (MMLU → Pro → HLE, FrontierMath) — so the visible record keeps "improving" while the measurement itself resets. The headroom that matters now sits in agentic and research-grade math, exactly where the remaining risk and value concentrate.
The forecast side is where the inputs run out physically: chip allocation, power per site, and human-text exhaustion all have 2028–2030 corner estimates. That is not doom — it's the flavor of slowdown that actually matters, and it is exactly what a weekly measurement of elasticity (not benchmark scores) would detect first.
The verification ledger: we check other analyses
Nothing on this page is opinion. Headline claims — ours and the field's — are re-derived from the raw Epoch CSVs and graded pass/fail. Reproducible in one command, forever.
| Claim | Our reproduction | Verdict |
|---|---|---|
| Reasoning-era ECI slope ≈ 14.5 pts/yr | 14.2 (R² .98) | match |
| Trailing-12-mo frontier pace ≈ 15.9 | 15.8 (R² .97) | match |
| LLaMA-1 yardstick: 10× params ≈ 14.4 ECI | 14.9 | match |
| 10× params ≈ 3.8 ECI since 2024 (family-matched) | direction confirmed (14.9 → 8.6) | needs active-params |
| IPP density doubling ≈ 3.4 mo (active) | 3.0–3.2 mo (per-total, dense window) | coverage-limited |
| Chip / power / data ceilings ≈ 2028–30 | not reproducible here (needs chip + METR data) | unchecked |
Method & reproducibility
What we do
Pull the five public Epoch AI datasets (AI models, ECI benchmarks, ECI frontier), join capability (ECI) to training compute and parameters by model, and fit a two-factor model ECI = a·(yr−2024) + θ·log₁₀(resource) + c separately for compute, parameters, and both combined. The elasticity terms (θ) are what you see collapse. The a-term is the algorithmic/go-of-time progress at fixed resources.
- Data: Epoch AI (public CSVs, updated weekly in this pipeline). Independent re-derivation; not affiliated.
- Frontier compute ± uncertainty: closed-lab FLOP estimates carry up to ~10× uncertainty at the edge. We plot raw values; slopes are robust to the mid-range, brittle at the very top.
- ECI is a composite: built from 60 benchmarks; it excludes pre-2023 models. It leans toward reasoning — a knowledge-heavy metric would reward raw size more.
- Active vs total params: Epoch stores total weights; MoE models inflate the denominator. Real per-active-parameter density is higher than plotted.
- This is measurement, not forecast. The 2028–30 machinery estimates are scenario work, quoted from the field, not predicted here.